Market Monitoring
VETA provides several panels for monitoring market activity in real time.
Market Ladder
Section titled “Market Ladder”The market ladder shows all instruments with live bid/ask prices, volumes, and price changes. Click any row to select the instrument and broadcast it to linked panels.
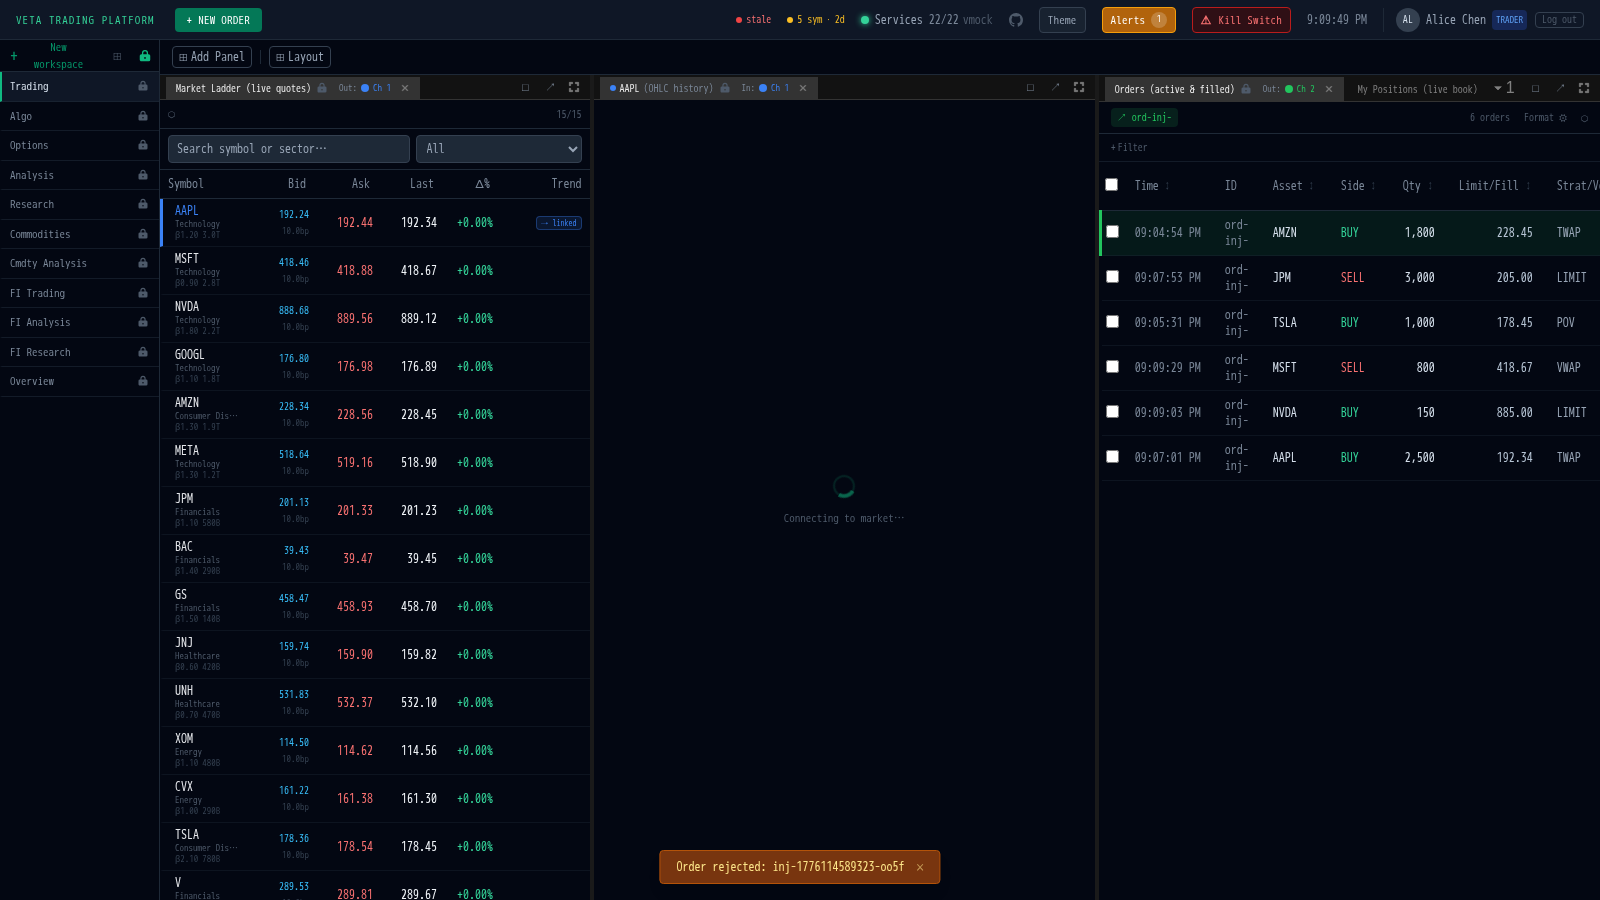
Features:
- Search: filter instruments by symbol or sector
- Sector filter: dropdown to show only a specific sector
- Price flash: green flash for uptick, red for downtick
- Virtualised rendering: handles hundreds of instruments smoothly
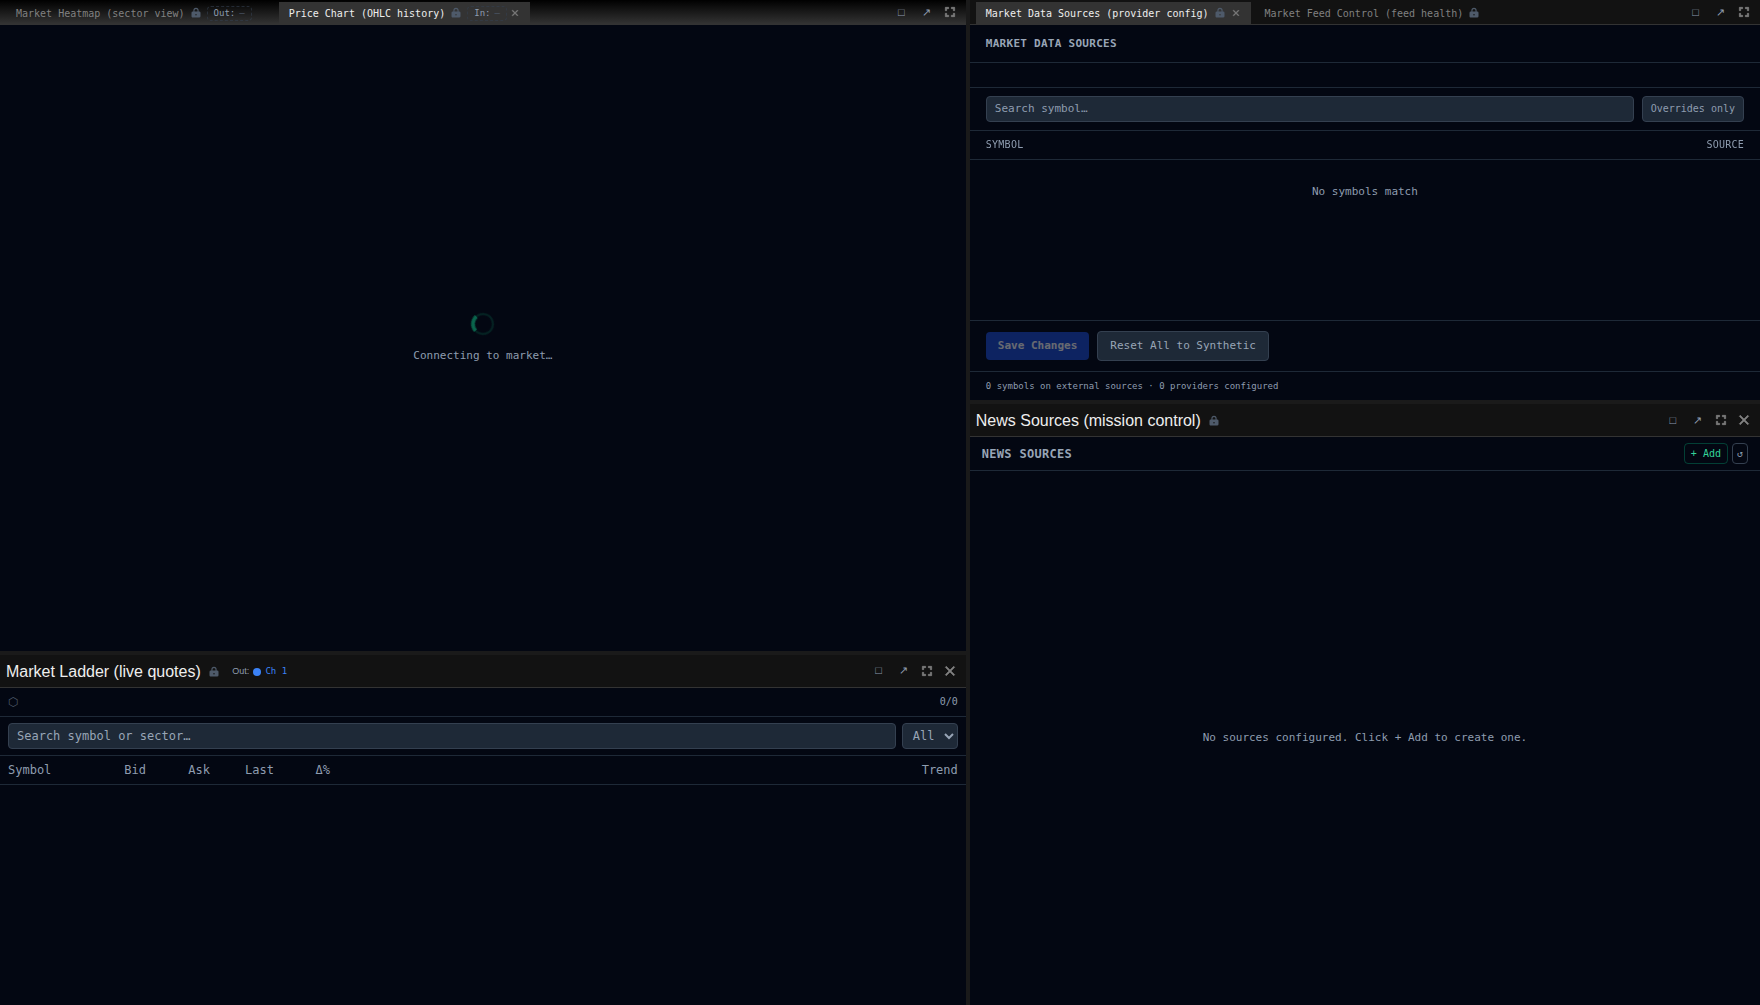
Price Charts
Section titled “Price Charts”The Candle Chart panel shows OHLCV candlestick data for the selected instrument. It responds to symbol selection from the market ladder or symbol search.
Market Heatmap
Section titled “Market Heatmap”The heatmap shows all instruments as a treemap, sized by market capitalisation and coloured by percentage change from session open.
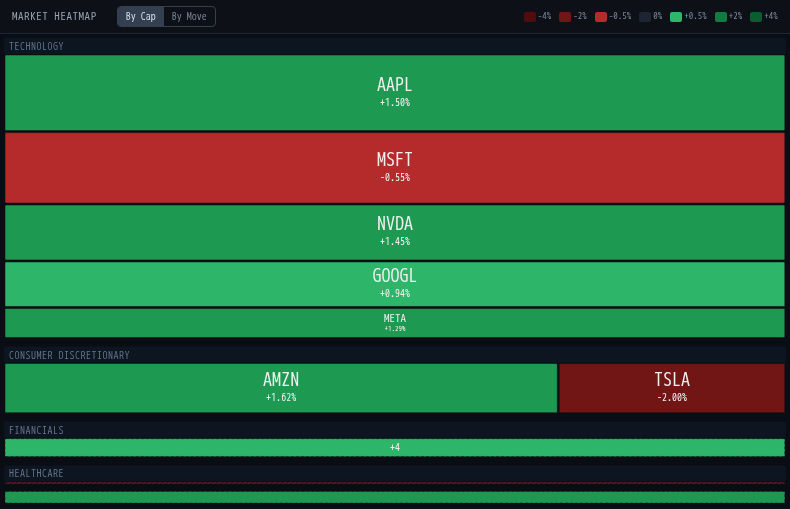
- Green: price up from open
- Red: price down from open
- Larger tiles: higher market cap
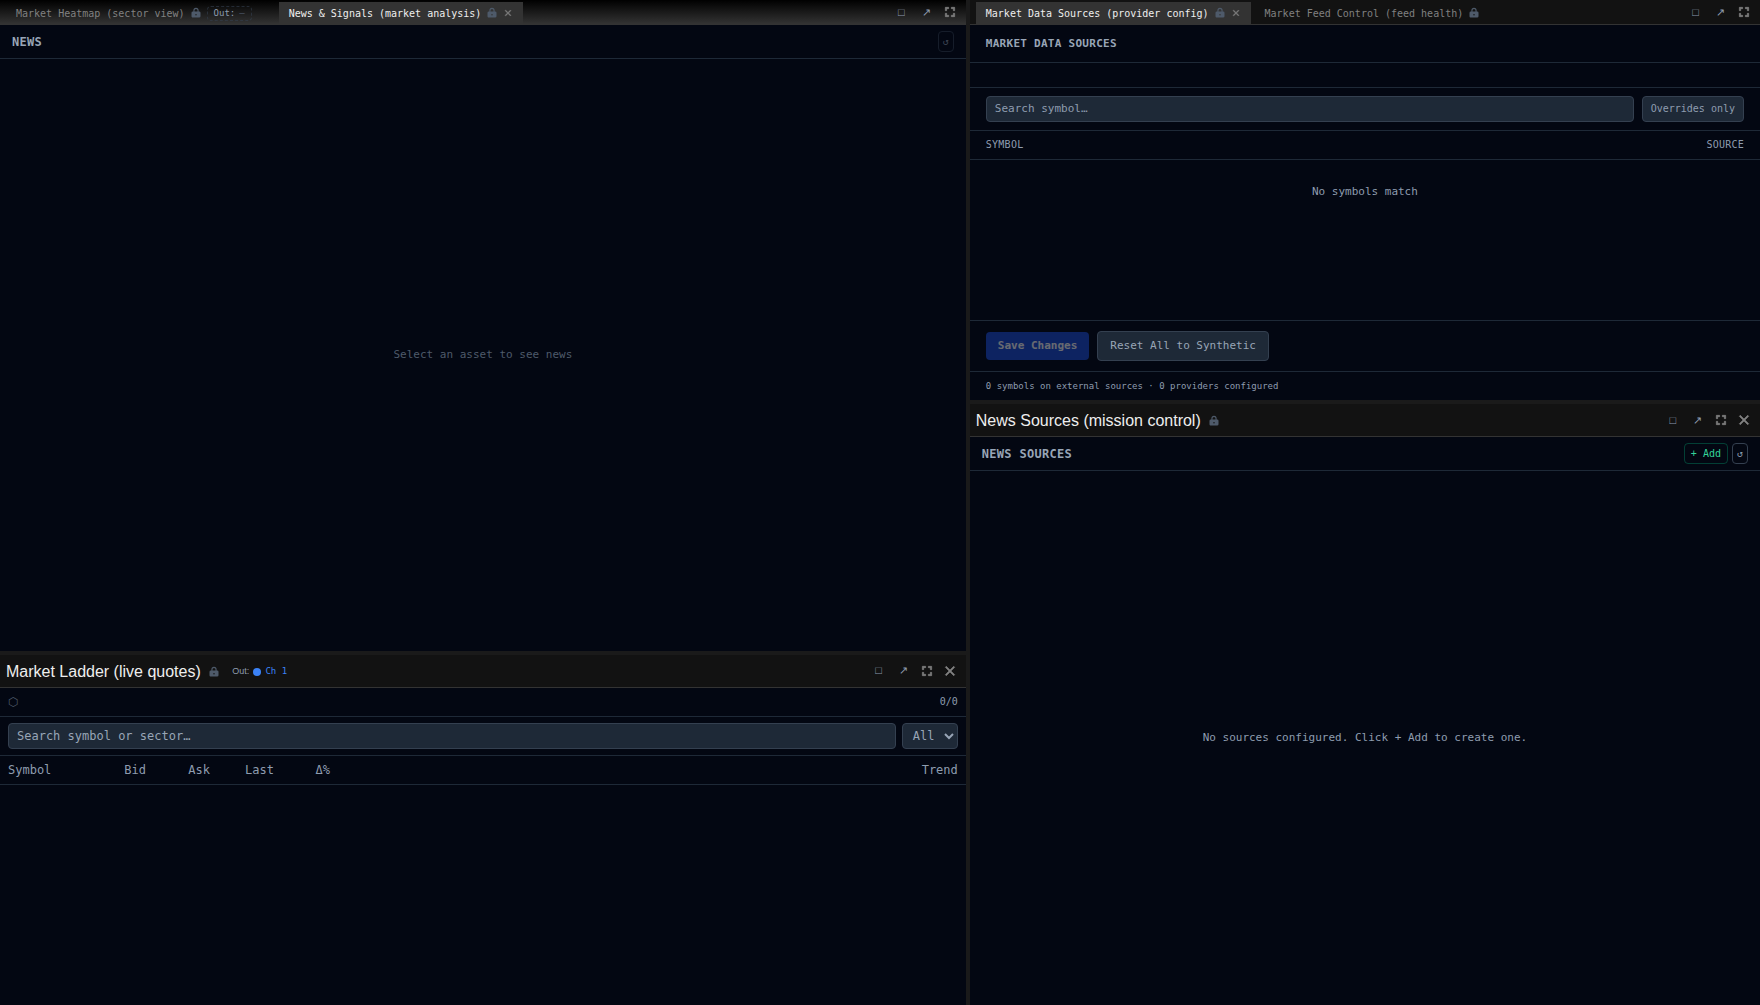
News Feed
Section titled “News Feed”The news panel shows live headlines with sentiment scoring:
- Positive sentiment highlighted in green
- Negative sentiment highlighted in red
- Headlines tagged with related symbols
System Status
Section titled “System Status”The header bar shows live system status:
| Indicator | Meaning |
|---|---|
| Feed status (green dot + “live”) | All data feeds are current |
| Feed status (amber + “slow”) | Some feeds are delayed |
| Feed status (red + “stale”) | Data feeds are offline |
| Data depth (e.g. “5 sym, 3d”) | Number of tracked symbols and minimum data history depth |
| Service health dots | Green/red indicators for each backend service |
When data depth is below 7 days, analytics accuracy is limited. Below 1 day, scenario analysis is unreliable.
Upgrade banner
Section titled “Upgrade banner”When the platform is undergoing maintenance, an orange banner appears at the top of the screen:
System upgrade in progress. Orders may be delayed or rejected.
Administrators control this banner, and it is dismissed automatically when the upgrade completes.