
Mission Control
When something is wrong, three pieces of information are needed: what is broken, where to look, and what to do about it. This page is the index. Everything below is a hop, not a hub.
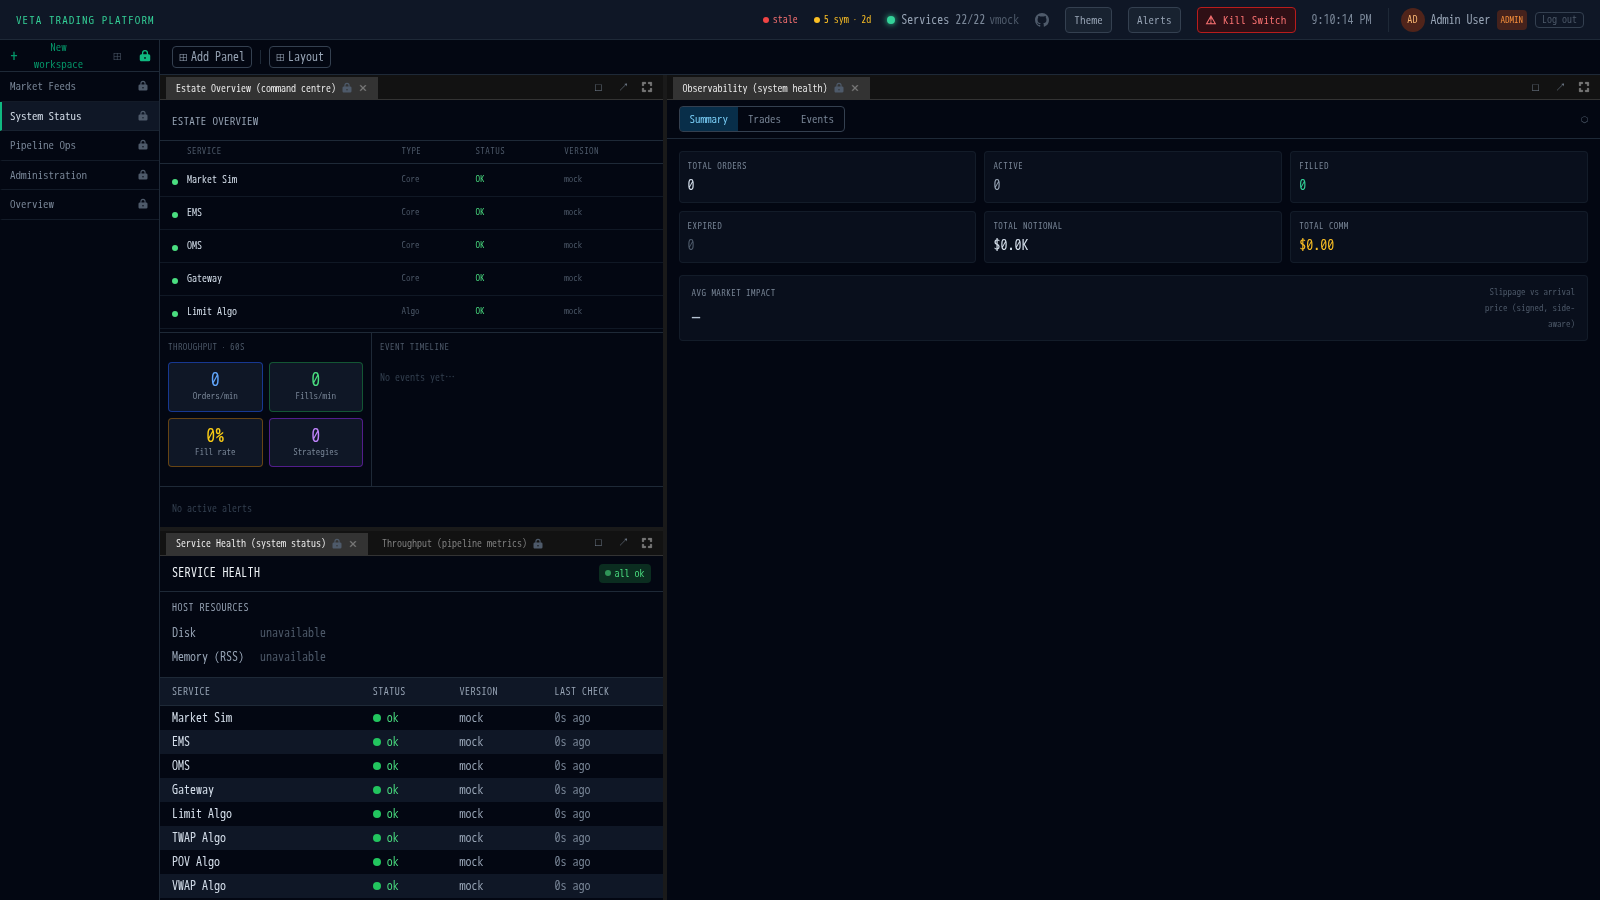
Live diagnostics (operator access)
Section titled “Live diagnostics (operator access)”The platform uses the standard Grafana LGTM stack for live observability (Grafana for dashboards, Tempo for traces, Loki for logs), plus Traefik's built-in dashboard for routing state, Redpanda Console for Kafka topic inspection, and Uptime Kuma for external health checks.
These run inside the deployment's private network and aren't exposed publicly. Operator-only credentials and URLs are in the team password manager.
In-app tools
Section titled “In-app tools”Common runbooks
Section titled “Common runbooks”Service restart loop
Section titled “Service restart loop”Read the failing service's logs first via Grafana, Loki, {service_name="<svc>"}. Common causes ordered by frequency:
- Missing env var. Most often a database URL or service host. Compare the service's
compose.ymlblock to its consumer module. - Schema migration not yet applied. The service depends on
db-migratecompleting. Checkdocker logs veta-db-migrate-1: exit 0 means done; anything else means a migration failed. - Dependency not healthy. A
depends_on: condition: service_healthywill hold the dependent service back. The unhealthy upstream is where the real problem is. - Port collision. Rare in compose. Check
docker psfor duplicate names.
Note: if the service has been deleted manually, the next auto-pull tick (every 5 min) will run deploy.sh, which brings the full compose stack back up. A restart loop cannot be papered over by stopping the container; fix the underlying issue.