LGTM stack
A separate Compose stack at observability/docker-compose.lgtm.yml provides metrics, logs, and traces. It is independent of the trading stack and can run on the same host or be pointed at a remote one.
Containers
Section titled “Containers”| Container | Image | Port (dev container) | Role |
| --- | --- | --- | --- |
| lgtm-grafana | grafana/grafana:11.4.0 | 3000 | Dashboards, alerting, datasource UI |
| lgtm-prometheus | prom/prometheus:v3.1.0 | 9090 | Time-series metrics; remote-write enabled |
| lgtm-loki | grafana/loki:3.3.2 | 3100 | Log aggregation |
| lgtm-tempo | grafana/tempo:2.7.1 | 3200 / 4319 | Distributed traces |
| lgtm-alloy | grafana/alloy:v1.7.0 | 12345 | Log + metric collector; tails service stdout |
Grafana is provisioned with the three datasources and a Trading folder containing both the project-specific dashboards and the official k6 Prometheus dashboard.
Bringing the stack up
Section titled “Bringing the stack up”docker compose -f observability/docker-compose.lgtm.yml up -dIn the dev container, open http://localhost:3000 once the stack is up. In production, Grafana is reachable at https://veta.mnetcs.com/grafana/. Anonymous read access is enabled; admin and edit access remain auth-gated.
Provisioned dashboards
Section titled “Provisioned dashboards”Grafana is auto-provisioned with the following dashboards under the Trading folder. They live in observability/grafana/provisioning/dashboards/ and update on disk-change without a Grafana restart.
| Dashboard | Source | What it shows | | --- | --- | --- | | Trading Overview | Loki via kafka-relay | Order pipeline counters, fill rate, algo heartbeat, service versions, live event feeds. Works without OTel. | | Service Performance (OTel) | Tempo span-metrics + Loki | Request/error rate and p50/p95/p99 latency per service, Top-N slowest/busiest spans, scoped log panel. | | Order Pipeline (Traces) | Tempo + Loki | Order lifecycle trace view: per-stage p95 latency, live service-graph nodeGraph, recent error/slow-trace tables. | | k6 Prometheus | Prometheus | Bundled k6 dashboard for load-test runs. |
The two OTel dashboards depend on the compose.observability.yml overlay being active. Without it there are no spans to render.
Live snapshots
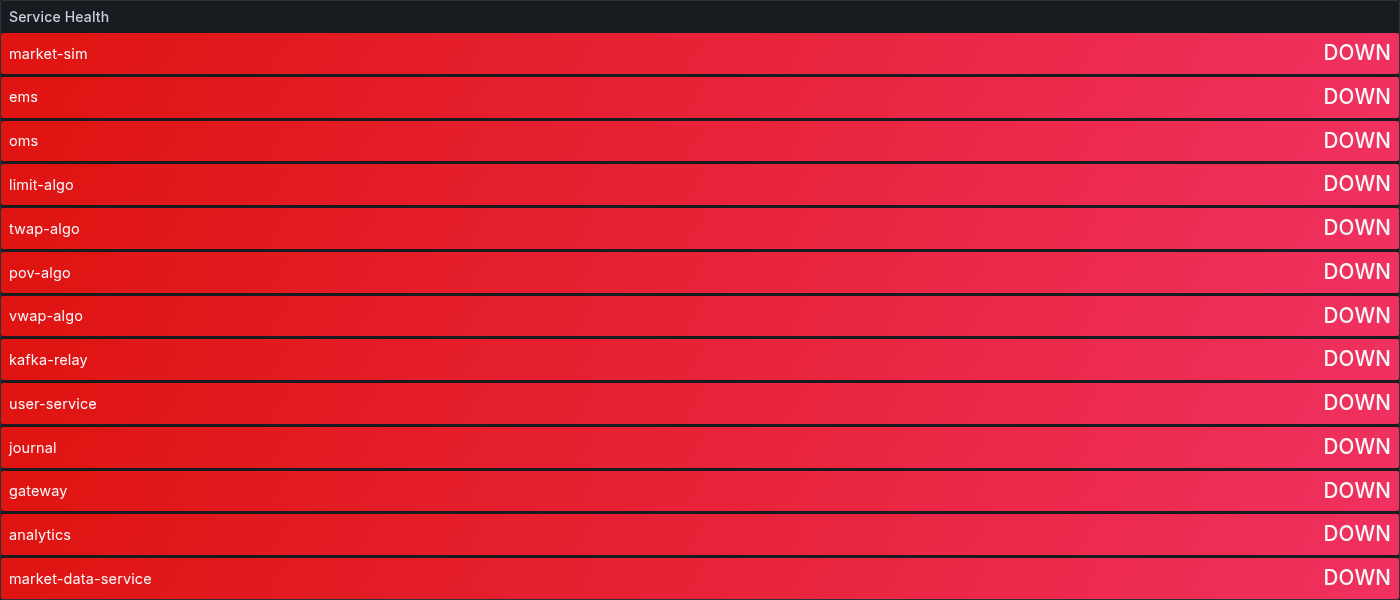
Section titled “Live snapshots”The screenshots below are captured directly from the production Grafana via its image-renderer by docs/site/scripts/capture-grafana-screenshots.mjs. To refresh, run npm run capture:grafana from docs/site/ against a host with the LGTM stack up. Click any panel for the full-resolution version.
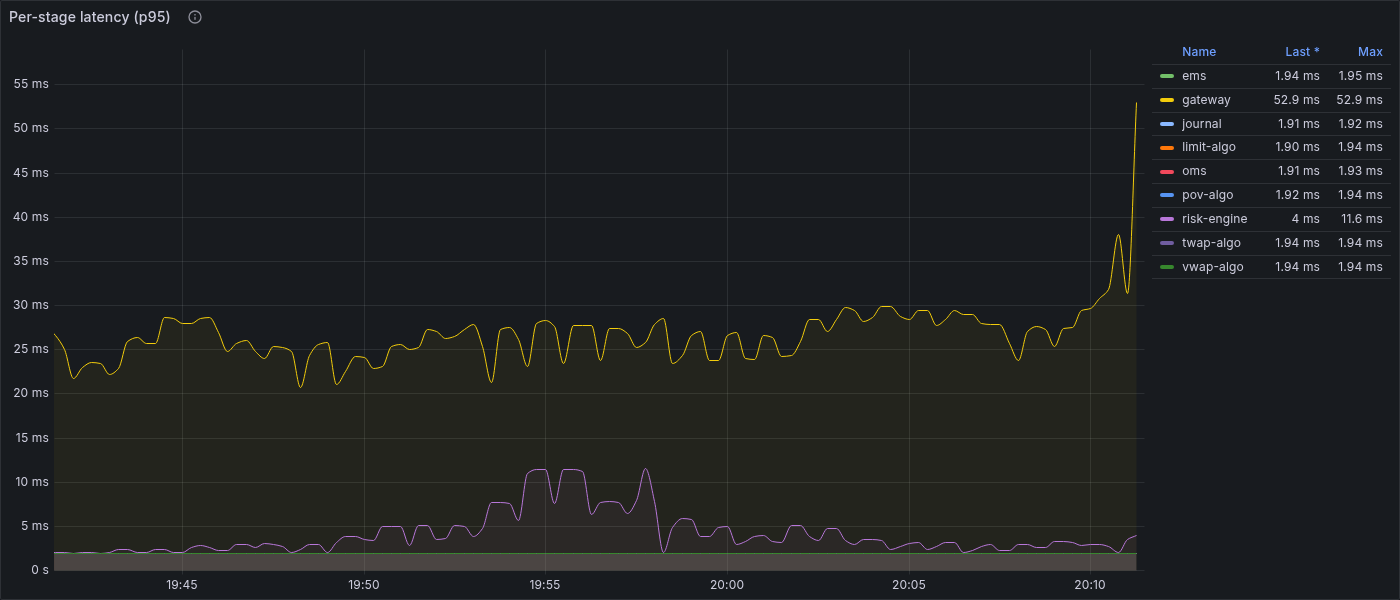
Order Pipeline (Traces)
Trace-driven view of the order lifecycle. The platform's HTTP and Kafka hops both propagate trace context, so a single submitted order produces one connected trace from Gateway through OMS, Risk, Algo, EMS, and Journal. This dashboard surfaces the slowest, the failed, and the most active.


Service Performance (OTel)
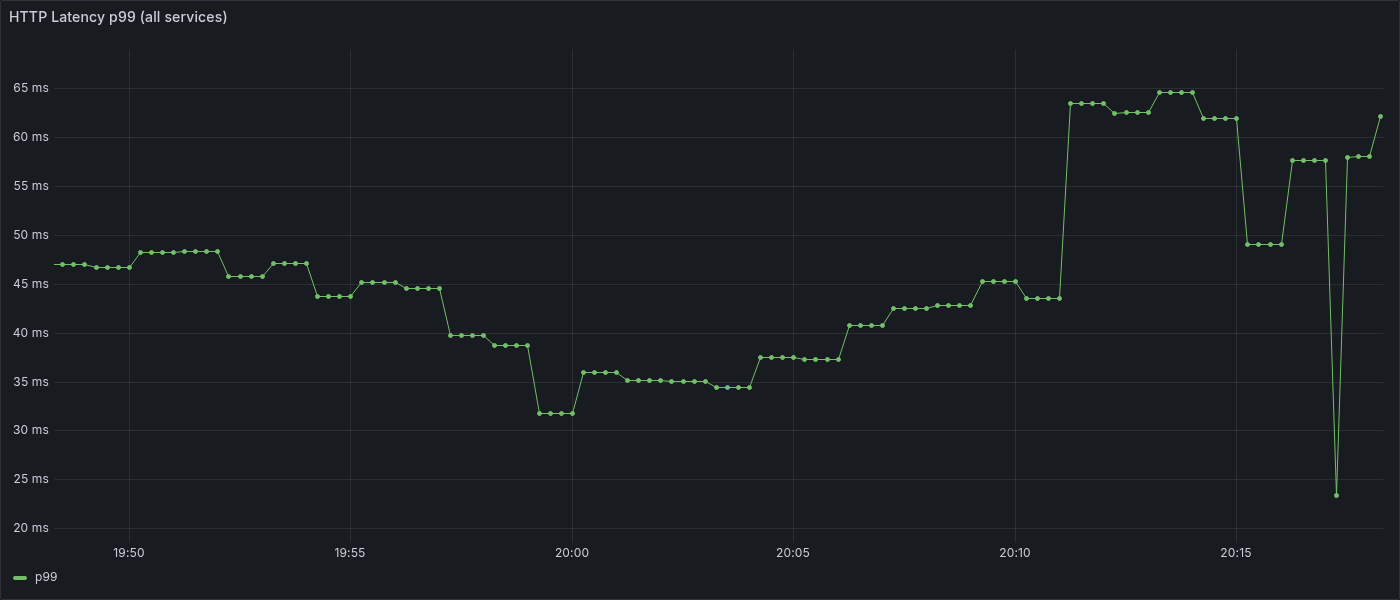
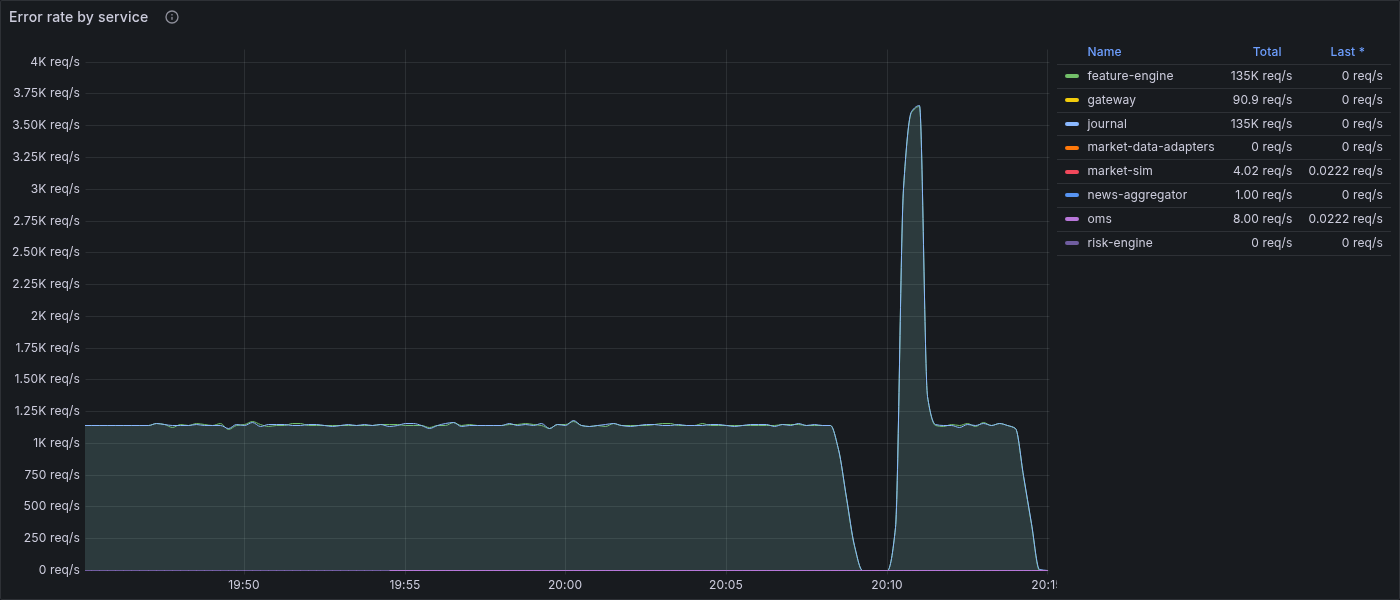
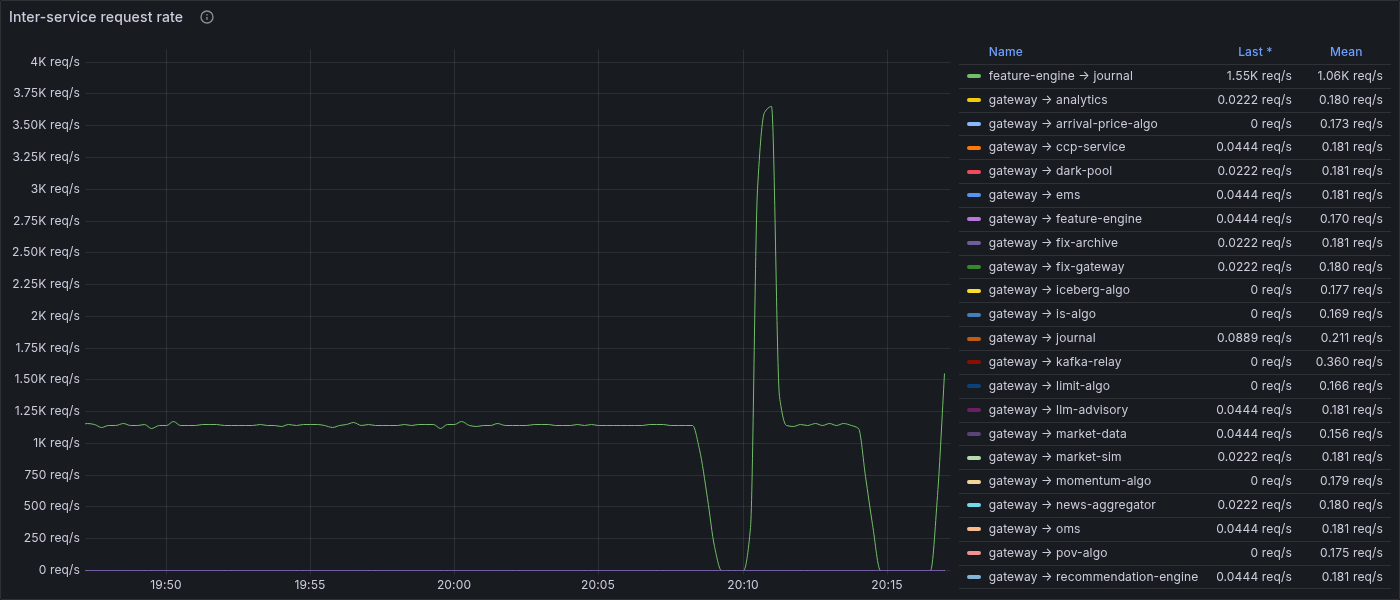
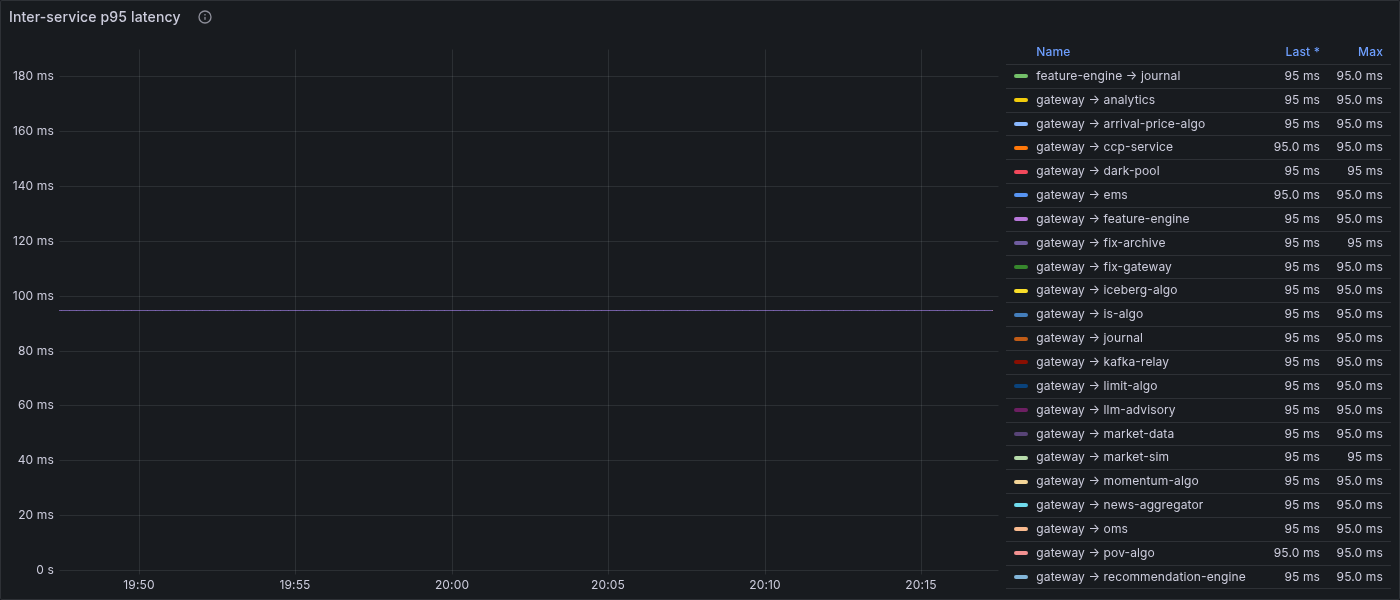
Per-service request rate, latency, errors, and resource usage — sourced from Deno's built-in OpenTelemetry instrumentation. All panels respect the service variable, so pick a service from the top to scope the view.
Trading Overview